More on the scientific method


Before dropping the balls we predicted how high they would bounce. The predictions started out outrageous with the kids claiming the ball would bounce all the way up to the ceiling. I tried to guide them reminding them we were only dropping the ball rather than throwing it down. When they were unconvinced, they recorded their predictions as stated.Then we dropped the ball and recorded the actual results.
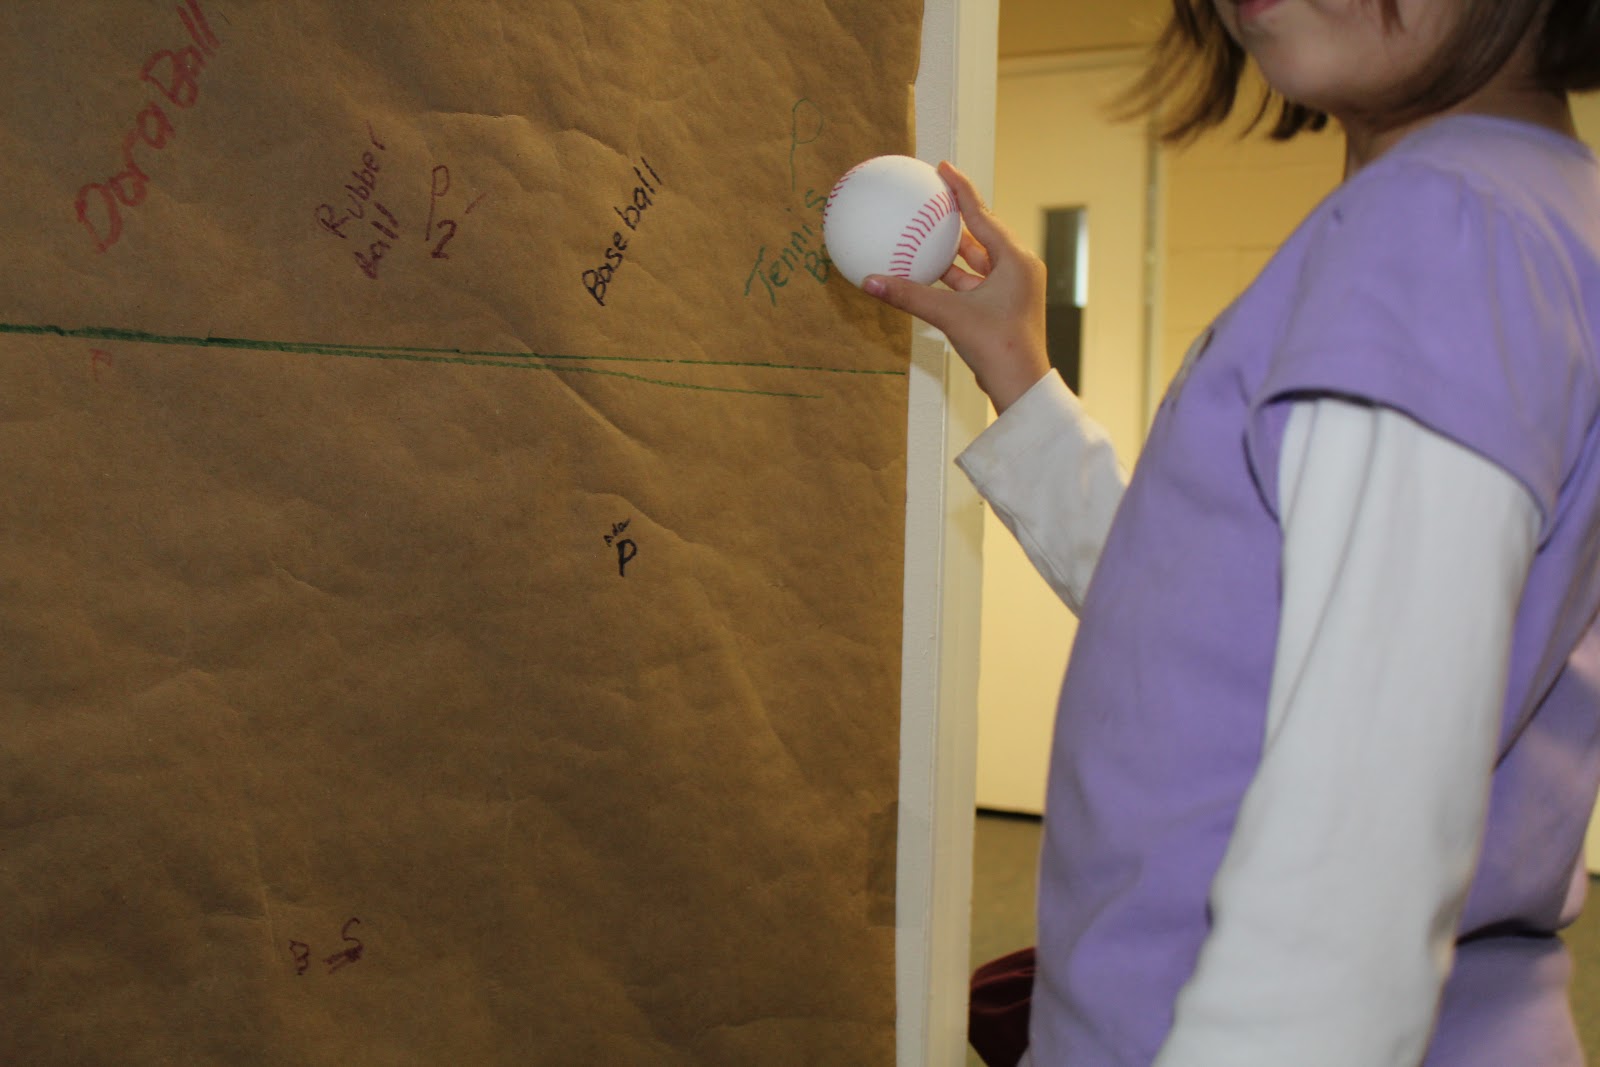
The balls came no where near their predictions obviously. As we went through the series of balls, the predictions became slightly more realistic, at least from certain students. One little guy was determined to keep his wild predictions.

After a round of prediction and results, we changed locations to a very different type of flooring to see what changes occurred. We made new predictions and ran new tests and compared the results. Everyone, grownups included, were very surprised with the results. The change made remarkably little difference in the results.


Fun science! Love it. Thank you for sharing.
ReplyDeleteOoohhhh. I love how thorough you are on your observations
ReplyDeleteAnd all the way o the roof would be impressive